What to Include in a Marketing Performance Review?
Discover how to conduct an effective marketing performance review by combining critical metrics, tea...

B2B digital marketing benchmarks are those trusty yardsticks that marketers lean on to track and size up their performance.
The B2B digital marketing landscape is moving at a breakneck pace driven by fresh technologies and shifting buyer behaviors and the ever-tightening grip of data privacy rules. Marketers need to keep a regular pulse on how their performance stacks up against industry standards. Benchmarks provide a straightforward way to see where you really stand, spot emerging trends and fine-tune your strategies accordingly.
Digital marketing benchmarks give you a snapshot of the average or typical performance metrics that tend to signal success within a particular industry or channel. When you stack B2B benchmarks against their B2C cousins you will notice B2B metrics lean more heavily on lead quality and drawn-out sales cycles. Multiple decision-makers usually have their two cents in the mix which underlines how complex and specialized business purchases can be.
Benchmark data often comes from a blend of sources each bringing its own flavor to the mix. These include industry reports cooked up by market intelligence firms, internal historical performance records in company archives, competitive analysis done through digital sleuthing tools and third-party analytics platforms quietly gathering anonymous data from various companies.
When it comes to snagging useful insights benchmarks usually shine brightest when broken down by the main digital marketing channels. This article shines a spotlight on vital metrics across content marketing, email marketing, pay-per-click (PPC), social media, SEO and account-based marketing (ABM).
B2B content marketing benchmarks usually lean on engagement metrics such as the average time people stick around with the content, social shares and click-through rates. They also consider lead conversion rates from those popular gated assets.
| Content Type | Average Engagement Rate | Average Conversion Rate | Lead Quality Score (1-10) |
|---|---|---|---|
| Blog Posts | 40% | 2.5% | 6 |
| White Papers | 55% | 8% | 8 |
| Webinars | 65% | 15% | 9 |
| Case Studies | 60% | 12% | 9 |
| Infographics | 45% | 3% | 5 |
| eBooks | 50% | 6% | 7 |
| Videos | 70% | 10% | 8 |
| Newsletters | 35% | 4% | 6 |
B2B email marketing campaigns typically see open rates hovering between 15-25% with click-through rates around 2-5%. Bounce rates usually stay low, under 1%, and unsubscribes tend to stay below 0.5%. Segmented and personalized campaigns generally perform better than one-size-fits-all approaches.
In B2B PPC campaigns, click-through rates usually hover around 2 to 5 percent—not too shabby if you ask me. Costs per click can swing quite a bit depending on the platform, but you’re generally looking at anywhere between three and eight dollars. Conversion rates tend to hang out in the 2 to 10 percent range, give or take.
| Platform | Average CPC | CTR | Conversion Rate | Cost Per Lead (CPL) |
|---|---|---|---|---|
| Google Ads | $4.50 | 3.5% | 4% | $112 |
| LinkedIn Ads | $7.50 | 2.5% | 6% | $125 |
Worth noting: Google Ads tends to bring a bit more clicks for your buck, while LinkedIn Ads, though pricier per click, often win at turning those clicks into actual leads. In my experience, it’s a classic case of quality versus quantity playing out in the advertising ring.
Social media engagement for B2B brands tends to vary from one platform to another. LinkedIn usually takes the crown with the highest engagement rates often hovering around 1 to 2 percent while Twitter trails not far behind.
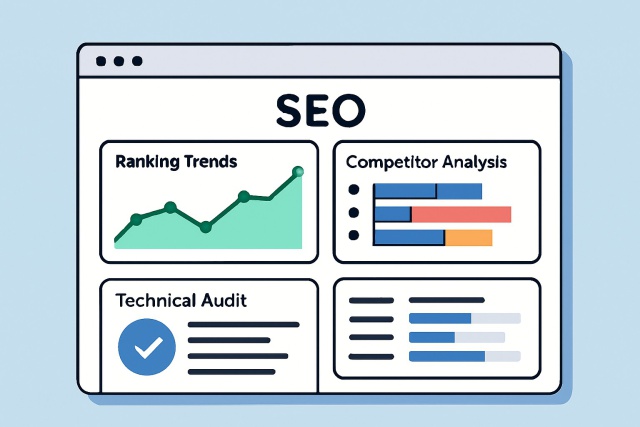
Organic traffic metrics in B2B SEO usually zoom in on targeted keyword rankings which in my experience take 3 to 6 months before you see anything worth bragging about. The average conversion rate from organic search typically hangs around 2 to 5 percent—a modest but steady range. The quality of backlinks plays a starring role in building authority and boosting visibility.
| SEO Metric | Benchmark Value | Impact on Lead Generation | Typical Timeframe to Achieve |
|---|---|---|---|
| Organic Traffic Growth | 15-25% year-over-year increase | Keeps a steady stream of qualified visitors knocking on your digital door | Usually takes about 6 to 12 months, so patience is definitely a virtue here |
| Keyword Ranking (Top 10) | 20-30% of targeted keywords rank in the top 10 | Gives your site a noticeable boost in visibility and click-through rates, kind of like turning heads in a crowded room | Often starts showing results between 3 and 6 months, so don’t give up too soon |
| Conversion Rate from Organic | 2-5% | Plays a key role in transforming casual visitors into quality leads—slow and steady wins the race here | This is an ongoing journey, not a one-time sprint, so keep nurturing those leads |
| Number of Quality Backlinks | 50-100 per quarter | Gradually builds up your domain authority, making your site more trustworthy over time | Typically, you’ll start seeing this take shape within 6 to 12 months—Rome wasn’t built in a day after all |
ABM success usually gets measured by a handful of key metrics like the engagement rate per account which typically hovers between 40 and 60 percent. Pipeline velocity is another good indicator and often shows quicker deal progress. Win rates tend to climb as well and generally land around the 30 to 40 percent mark. Deal sizes often get a nice boost thanks to personalized multi-touch approaches that aim to connect on a deeper level.
To really get the most out of benchmarks, it is worth lining up your marketing performance data against industry standards. This little exercise can shine a light on areas where you might be falling behind or reveal those hidden pockets bursting with growth potential.
Gather detailed and accurate performance data from your marketing channels because good decisions require solid facts.
Choose benchmark metrics that truly reflect what your business is about instead of just picking numbers that look impressive on paper.
Explore the differences to find any gaps or weaknesses that might pleasantly surprise you.
Set goals that are realistic and measurable since vague wishes don’t move the needle.
Develop tactical plans and assign the right resources to bring them to life.
Monitor progress and be ready to adjust your strategies as new benchmark data arrives because flexibility is essential for staying on track.
When setting KPIs using benchmarks, it’s key to find that sweet spot between aiming high and keeping your feet firmly on the ground by reflecting on past performance and the current market landscape. Don’t fall into the trap of zeroing in just on industry top scores without giving a nod to your own unique strengths and honest limitations.
Continuous benchmarking is absolutely key in B2B marketing—especially since buyer behaviors and platforms have a knack for changing at the drop of a hat. Without a solid baseline to hold onto, marketers often find themselves playing catch-up, following the market shifts instead of, ideally, staying one step ahead. – Jane Doe, Digital Marketing Analyst
Interpreting benchmarks calls for careful thought. Data samples can swing widely, industries and company sizes vary, and digital behaviors change at lightning speed.
Marketers often keep a close eye on digital marketing benchmarks using a blend of analytics platforms like Google Analytics and HubSpot, along with tools designed for specific platforms such as LinkedIn Analytics. On top of that, they usually lean on industry report subscriptions like MarketingSherpa and Gartner to stay in the loop.

Comprehensive digital marketing dashboard showing key B2B benchmark metrics across channels
New technologies like AI-driven analytics and machine learning together with tighter data privacy rules like GDPR and CCPA are transforming how b2b digital marketing benchmarks get calculated and put to use.
16 articles published
Having pioneered innovative social media strategies, Mariam El-Khatib is an authority on leveraging online communities and influencer networks to amplify brand reach and engagement.
Read Pages
Discover how to conduct an effective marketing performance review by combining critical metrics, tea...

Master Google Alerts to track your brand effectively. Discover step-by-step strategies to monitor me...

Understand why SEO ranking fluctuations happen and discover a systematic approach to monitor, diagno...

Discover the leading enterprise SEO SaaS tools of 2024, ranked and reviewed to help large organizati...